Attempts to address traffic congestion commonly rely on increasing roadway capacity, e.g. by building new roadways or adding lanes to existing facilities. But studies examining that approach indicate it is only a temporary fix. They consistently show that adding roadway capacity actually increases network-wide vehicle miles traveled (VMT) by a nearly equivalent proportion within a few years, reducing or negating any initial congestion relief. That increase in VMT is called “induced travel.”
The induced travel concept is not new. The phenomenon has been theorized and anecdotally observed for more than a century (1962, 1992, 2004; Ladd, 2013). And it is explained by the bedrock economic principles of supply and demand: “adding capacity decreases travel time, in effect lowering the ‘price’ of driving; when prices go down, the quantity of driving goes up” (Handy and Boarnet, 2014a).
The magnitude of the induced travel effect is commonly measured as the elasticity of VMT with respect to lane miles:
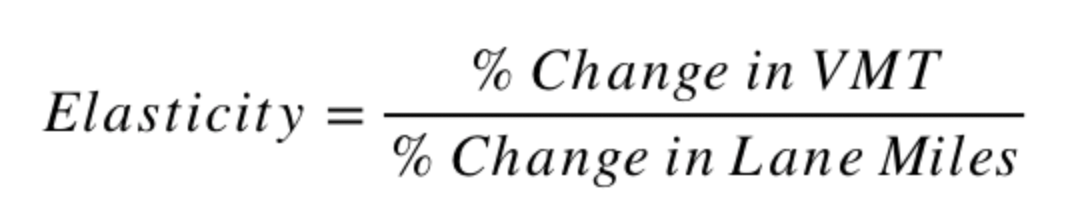
The elasticity is the percentage increase in VMT in the studied area that results from a 1% increase in lane miles in that area. An elasticity of 1.0 means that VMT will increase by the same percentage as the increase in lane miles. The greater the elasticity, the greater the increase in VMT from a given increase in roadway capacity.
Most recent studies have estimated elasticities in the same ballpark, despite using a range of methods to control for other VMT-inducing factors (such as population, income, geography, and fuel cost) and the bi-directional relationship between VMT and capacity expansion. In general, the studies show that a 10-percent increase in capacity is likely to increase network-wide VMT by at least 7 to 10 percent (an elasticity of 0.7 to 1.0) in the long run (3 to 10 years), at least for capacity expansions on major roadways with Federal Highway Administration (FWA) functional classifications of 1, 2, or 3. These longer-term elasticities account for shorter-term shifts in travel (as people take advantage of the increased capacity and reduced cost of vehicle travel by driving more), as well as longer-run growth and dispersion of residential and business location and development.
For more information on the induced travel effect and a review of the empirical studies that have explored the phenomenon and estimated induced travel elasticities, see Volker and Handy (2022). Please also see the References section below for a list of relevant studies, reviews, and policy briefs.
This Calculator allows users to estimate the VMT induced annually as a result of expanding the capacity of publicly owned roadways, like those managed by the California Department of Transportation (Caltrans), in one of California’s urbanized counties (counties within a metropolitan statistical area (MSA)). The Calculator currently applies only to publicly owned facilities with FHWA functional classifications of 1, 2 or 3. That corresponds to interstate highways (class 1), other freeways and expressways (class 2), and other principal arterials (class 3).
Caltrans included the Calculator in its 2020 Transportation Analysis Framework (TAF) as a method to estimate – or at least benchmark – induced VMT: “In cases where the NCST Calculator can be directly used, it should either be used exclusively or used to benchmark results from a [travel demand model]” (Caltrans, 2020 , p. 14). Caltrans’ recommendation is supported by the report of a panel of experts convened by Caltrans to guide its choice of induced travel estimation methods for the TAF (Deakin et al., 2020).
Calculator use might not appropriate in all circumstances or for all purposes, however. The following caveats apply, which are discussed further on the FAQ page:To estimate the induced VMT for capacity expansion projects, the Calculator solves the following equation based on the user-specified project geography and lane mile length:
The Calculator produces a point estimate of induced VMT, as well as a rough 95% confidence interval (+/-20%) surrounding that estimate. Data sources and specifications for the equation inputs are as follows:
Lane Miles. The Calculator uses lane mileage data from Caltrans’ Transportation System Network (TSN) database (similarly reported in the Highway Performance Monitoring System [HPMS]). The user has the option to use baseline data from 2016, 2017, 2018, 2019, 2022, 2023, or 2024. The percent change in lane miles is calculated by dividing the number of project-added lane miles (input by the user) by the total lane miles of the same facility type (either class 1 or class 2 and class 3 combined) in the same geography. For interstate highways (class 1), lane mileage is calculated at the MSA level. For other freeways, expressways and major arterials (classes 2 and 3) managed by public agencies, lane mileage is calculated at the county level. The choice of geographies is discussed further below, in conjunction with elasticities. The data is available here.
Existing VMT. The Calculator uses VMT data retrieved using Caltrans’ TSN and HPMS database. The VMT is tallied for each county and each FHWA functional classification. The user has the option to use baseline data from 2016, 2017, 2018, 2019, 2022, 2023, or 2024 (the same baseline year is used for both lane miles and VMT). As with lane miles, existing VMT on interstate highways (class 1) is calculated at the MSA level, and existing VMT on other publicly owned freeways, expressways and major arterials (classes 2 and 3) is calculated at the county level. The data is available here.
Elasticities. The Calculator uses an elasticity of 1.0 for capacity expansions on interstate highways, and an elasticity of 0.75 for capacity expansions on class 2 or 3 facilities. The same elasticities apply to additions of general-purpose lanes as to additions of HOV lanes and HOT lanes, since the available empirical evidence suggests that new HOV and HOT lanes might have similar induced travel effects as general-purpose lane expansions, as discussed above.
For interstate highways, the 1.0 elasticity derives from Duranton and Turner (2011) – perhaps the most thorough and stringently vetted study of induced travel in the US to date – as well as subsequent studies that also use robust statistical methods to control for the bi-directional relationship between VMT and capacity expansion. Duranton and Turner’s study used data from 1983, 1993 and 2003 for all MSAs in the United States that had nonzero interstate lane mileage in all three years. Among other modeling, the study used a two-stage least squares regression with three instrumental variables to estimate the elasticity of vehicle kilometers traveled (VKT) on interstate highways in the 228 studied MSAs with respect to interstate lane kilometers in those MSAs. The authors concluded that their estimation method better controls for the possible bi-directional relationship between VMT and lane miles than the methods used in previous studies. Using that “preferred estimation method,” their “preferred estimate” was a longer-run (10-year) elasticity of 1.03. However, while the authors concluded that “diversion of traffic from other road networks does not appear to play a large role,” they cautioned that they could not “rule out the absence of a substitution effect.” They estimated that the “diversion of traffic from other classes of roads accounts for between 0 and 10 percent of the total [induced] interstate VKT.”
Like Duranton and Turner (2011), the Calculator uses MSAs as the unit of analysis for interstate highway capacity expansions. The Calculator also uses a similar VMT elasticity (1.0), albeit rounded down (in part to account for the (small) potential substitution effect). That accords with Handy and Boarnet’s (2014a) conclusion that the best estimate for the longer-run VMT elasticity for highway lane additions is close to 1.0. It is also consistent with more recent studies that have estimated long-run induced VMT elasticities using instrumental variables, including Melo et al. (2012) (elasticity of 0.989 for major [class 3] and minor [class 4] arterials in 100 urbanized areas in the U.S.), Graham et al. (2014) (elasticity of 0.772 for class 1, 2, 3, and 4 [minor arterial] facilities in 101 urbanized areas in the U.S.), Hsu and Zhang (2014) (elasticity of between 1.24 and 1.34 for Japan’s national expressways), Hymel (2019) (elasticity of between 0.89 and 1.06 for freeways and other limited-access roads in Census-defined urban areas in the U.S.) and Garcia-López et al. (2020) (elasticity of 1.21 for highways in functional urban areas in 29 European countries). See Volker and Handy (2022) for further discussion of these studies and the induced travel literature generally.
For other highways, expressways and major arterials managed by public agencies, the 0.75 elasticity derives from Duranton and Turner (2011) and Cervero and Hansen (2002), as well as subsequent US-based studies that also use robust statistical methods to control for the bi-directional relationship between VMT and capacity expansion. While Duranton and Turner (2011) could not use their preferred method to estimate elasticities for state highways and other “major roads” besides interstates (including class 2-5 facilities), their elasticity estimates using ordinary least squares regression all fall between 0.66 and 0.90. Cervero and Hansen (2002) similarly estimated a longer-run (5-year) VMT elasticity of 0.79 for lane mile additions to class1-3 roadways in California’s urbanized counties (then 34, now 37), using three-stage least squares regression. Those elasticities are similar to other longer-term elasticities calculated for combined major road types (not just interstate highways) in California and across the United States, ranging between 0.77 and 1.06 (Graham et al., 2014; Hymel, 2019; Melo et al., 2012).
Like Cervero and Hansen (2002), the Calculator uses urbanized counties (those within MSAs) as the unit of analysis for capacity expansions on non-interstate highways, expressways and major arterials managed by public agencies. The Calculator also uses a similar VMT elasticity for those facilities (0.75) as Cervero and Hansen (2002) estimated for state-owned roadways (0.79), and within the range Duranton and Turner (2011) found for non-interstate “major roads” in the urbanized areas of MSAs (0.66 to 0.90). The Calculator’s 0.75 elasticity is rounded down from the estimates of Cervero and Hansen (2002) and Duranton and Turner (2011), in part to account for the (small) potential substitution effect discussed in Duranton and Turner (2011).
See Volker and Handy (2022) and Volker et al. (2020) for further discussion of the induced travel literature and the analysis of induced travel in the environmental review process.
Anderson, M. L., Davis, L. W., & Safavi, L. (2021). Estimating Induced Travel from Capacity Expansions on Congested Corridors. California Air Resources Board and California Environmental Protection Agency. Available at: https://ww2.arb.ca.gov/sites/default/files/2021-04/18RD022.pdf
Cairns, S., Hass-Klau, C., & Goodwin, P. (1998). Traffic Impact of Highway Capacity Reductions: Assessment of the Evidence. London: Landor Publishing. Available at: https://www.cycling-embassy.org.uk/sites/cycling-embassy.org.uk/files/documents/Traffic%20Impact%20of%20Highway%20Capacity%20Reductions-%20Assessment%20of%20the%20Evidence.pdf
California Legislative Analyst’s Office. (2000). HOV Lanes in California: Are They Achieving Their Goals? Retrieved from: https://lao.ca.gov/2000/010700_hov/010700_hov_lanes.html.
Caltrans. (2020). Transportation Analysis Framework: Evaluating Transportation Impacts of State Highway System Projects. Retrieved from: https://dot.ca.gov/-/media/dot-media/programs/sustainability/documents/2020_09_10_1st_edition_taf_fnl_a11y.pdf
Caltrans. (2019). Express Lanes. Retrieved from: https://dot.ca.gov/programs/traffic-operations/express-lanes.
Caltrans. (2018). California Highway System. Retrieved from: https://caltrans.maps.arcgis.com/apps/webappviewer/index.html?id=026e830c914c495797c969a3e5668538.
Cervero, R., & Hansen. (2002). “Induced Travel Demand and Induced Road Investment: A Simultaneous Equation Analysis.” Journal of Transport Economics and Policy, 36(3), 469-490. Available at: https://www.ingentaconnect.com/content/lse/jtep/2002/00000036/00000003/art00005.
Chang, H., Indra, D., & Maiti, A. (2020). Does Building Highways Reduce Traffic Congestion? Working paper. Available at: https://papers.ssrn.com/sol3/papers.cfm?abstract_id=3674793
Chen, W., & Klaiber, H. A. (2020). “Does Road Expansion Induced Traffic? An Evaluation of Vehicle-Kilometers Traveled in China.” Journal of Environmental Economics and Management, 104(102387). Available at: https://doi.org/10.1016/j.jeem.2020.102387
Deakin, E., et al. (2020). Induced Vehicle Miles of Travel Resulting from Highway Projects: Findings and Recommendations from an Expert Panel. Prepared for Caltrans. Available at: https://dot.ca.gov/-/media/dot-media/programs/transportation-planning/documents/sb-743/2020-09-21-sb-743-expert-panel-rpt-fnl-a11y.pdf
Downs, A. (2004). Still Stuck in Traffic: Coping with Peak-Hour Traffic Congestion. Washington, DC: Brookings Institution Press.
Downs, A. (1992). Stuck in Traffic: Coping with Peak-Hour Traffic Congestion. Washington, DC: Brookings Institution Press.
Downs, A. (1962). “The Law of Peak-Hour Expressway Congestion.” Traffic Quarterly, 16(3), 393-409. Available at: https://trid.trb.org/view/694596.
Duranton, G., & Turner, M. A. (2011). “The Fundamental Law of Road Congestions: Evidence from US Cities.” American Economic Review, 101(6), 2616-2652. doi: 10.1257/aer.101.6.2616. Available at: https://www.aeaweb.org/articles?id=10.1257/aer.101.6.2616.
Fulton, L. M., Noland, R. B., Meszler, D. J., & Thomas, J. V. (2000). “A Statistical Analysis of Induced Travel Effects in the U.S. Mid-Atlantic Region.” Journal of Transportation and Statistics, 3(1). Available at: https://doi.org/10.21949/1501618
Garcia-López, M., Pasidis, I., & Viladecans-Marsal, E. (2020). Congestion in Highways When Tolls and Railroads Matter: Evidence from European Cities. Working paper. Available at: https://papers.ssrn.com/sol3/papers.cfm?abstract_id=3785888
González, R. M., & Marrero, G. A. (2012). “Induced Road Traffic in Spanish Regions: A Dynamic Panel Data Model.” Transportation Research Part A, 46(3), 435-445. Available at: doi:10.1016/j.tra.2011.11.003
Graham, D. J., McCoy, E. J, & Stephens, D. A. (2014). “Quantifying Causal Effects of Road Network Capacity Expansions on Traffic Volumes and Density via a Mixed Model Propensity Score Estimator.” Journal of the American Statistical Association, 109(508), 1440-1449. doi:10.1080/01621459.2014.956871. Available at: https://www.tandfonline.com/doi/abs/10.1080/01621459.2014.956871.
Handy, S., & Boarnet, M. G. (2014a). Impact of Highway Capacity and Induced Travel on Passenger Vehicle Use and Greenhouse Gas Emissions: Policy Brief. Prepared for the California Air Resources Board. Retrieved from: https://ww3.arb.ca.gov/cc/sb375/policies/hwycapacity/highway_capacity_brief.pdf.
Handy, S., & Boarnet, M. G. (2014b). Impact of Highway Capacity and Induced Travel on Passenger Vehicle Use and Greenhouse Gas Emissions: Technical Background Document. Prepared for the California Air Resources Board. Retrieved from: https://ww3.arb.ca.gov/cc/sb375/policies/hwycapacity/highway_capacity_bkgd.pdf.
Handy, S. (2015). Increasing Highway Capacity Unlikely to Relieve Traffic Congestion: Policy Brief. Prepared for the National Center for Sustainable Transportation. Retrieved from: https://escholarship.org/uc/item/58x8436d.
Hansen, M., & Huang, Y. (1997). “Road Supply and Traffic in California Urban Areas.” Transportation Research Part A, 31(3), 205-218. Available at: https://doi.org/10.1016/S0965-8564(96)00019-5
Hsu, W., & Zhang, H. (2014). “The Fundamental Law of Highway Congestion Revisited: Evidence from National Expressways in Japan.” Journal of Urban Economics, 81: 65-76. doi:10.1016/j.jue.2014.02.002. Available at: https://www.sciencedirect.com/science/article/pii/S0094119014000126?via%3Dihub.
Hymel, K. M. (2019). “If You Build It, They Will Drive: Measuring Induced Demand for Vehicle Travel in Urban Areas.” Transport Policy, 76: 57-66. doi:10.1016/j.tranpol.2018.12.006. Available at: https://www.sciencedirect.com/science/article/abs/pii/S0967070X18301720.
Ladd, B. (2013). “You Can’t Build Your Way out of Congestion.” – Or Can You? disP – The Planning Review, 48(3), 16-23. DOI: 10.1080/02513625.2012.759342
Melo, P. C., Graham, D. J., & Canavan, S. (2012). “Effects of Road Investments on Economic Output and Induced Travel Demand: Evidence from Urbanized Areas in the United States.” Transportation Research Record: Journal of the Transportation Research Board, 2297: 163-171. doi:10.3141/2297-20. Available at: https://journals.sagepub.com/doi/10.3141/2297-20.
Milam, R. T., Birnbaum, M., Ganson, C., Handy, S., & Walters, J. (2017). “Closing the Induced Vehicle Travel Gap between Research and Practice.” Transportation Research Record: Journal of the Transportation Research Board, 2653: 10-16. doi:10.3141/2653-02. Available at: https://journals.sagepub.com/doi/10.3141/2653-02.
Naess, P., Nicolaisen, M. S., & Strand, A. (2012). “Traffic Forecasts Ignoring Induced Demand: A Shaky Fundament for Cost-Benefit Analyses.” European Journal of Transport and Infrastructure Research, 12(3), 291-309. doi:10.18757/ejtir.2012.12.3.2967. Available at: https://pdfs.semanticscholar.org/9e33/14ac9d66c25b2a1db664dcc7747c13c5f3dc.pdf?_ga=2.187485864.1840910524.1573238132-456656367.1573238132.
Noland, R. B., & Cowart, W. A. (2000). “Analysis of Metropolitan Highway Capacity and the Growth in Vehicle Miles of Travel.” Transportation, 27: 363-390. Available at: https://doi.org/10.1023/A:1005288826997
Rentziou, A., Gkritza, K., & Souleyrette, R. R. (2012). “VMT, Energy Consumption, and GHG Emissions Forecasting for Passenger Transportation. Transportation Research Part A, 46(3), 487-500. Available at: https://doi.org/10.1016/j.tra.2011.11.009
Su, Q. (2011). “Induced Motor Vehicle Travel from Improved Fuel Efficiency and Road Expansion.” Energy Policy, 39(11), 7257-7264. Available at: https://doi.org/10.1016/j.enpol.2011.08.047
Volker, J. M. B., & Handy, S. (2022). Updating the Induced Travel Calculator. National Center for Sustainable Transportation. Report No. NCST-UCD-RR-22-34. Available at: https://escholarship.org/uc/item/1hh9b9mf
Volker, J. M. B., Lee, A. E., & Handy, S. (2020). “Induced Vehicle Travel in the Environmental Review Process.” Transportation Research Record: Journal of the Transportation Research Board (in press). doi:10.1177/0361198120923365. Available at: https://sci-hub.tw/10.1177/0361198120923365
For questions regarding the induced VMT Calculator, please contact:
Jamey Volker (jvolker@ucdavis.edu), or
Susan Handy (slhandy@ucdavis.edu)